This is a write-up of my first program, a C++ executable to analyze video footage and extract a histogram of a fish’s position over time.
There are a few steps here, and I’ll go through each
- Determine a flow regiment; for example: 11 volts for an hour, stop, 10 volts for an hour, stop, etc.
- Take a photo of the fish’s container and give it to the user to crop boundaries to eliminate whitespace
- Turn on the motor with the desired voltage, start recording video, then repeat for each step in the regiment
- Chop the videos into images
- Read the images, eliminate everything that is not a fish, and produce only-fish images
- Determine orientation of the fish in these fish-only images and compile that data into a histogram
Determining a flow regiment
This is a basic interactive prompt in C++ which will create a text file that looks like:
5
0
5_5
0
7
0
8
Each number corresponds to a compiled, executable C++ binary. An example file would read:
#define base 0x378
#define value 255

int main(){
  if (ioperm(base,1,1)){
    fprintf(stderr, "Couldn't work");
  }
  cout << "Data pins 3 and 7 set to 0, 4.5v chip activated\n";
  outb(187,base);
  return 0;
}
This will turn on a parallel port pin, which tells a custom piece of hardware I built that it wants 4.5 volts to the motor controlling the speed of the water.
Taking a photo and cropping boundaries
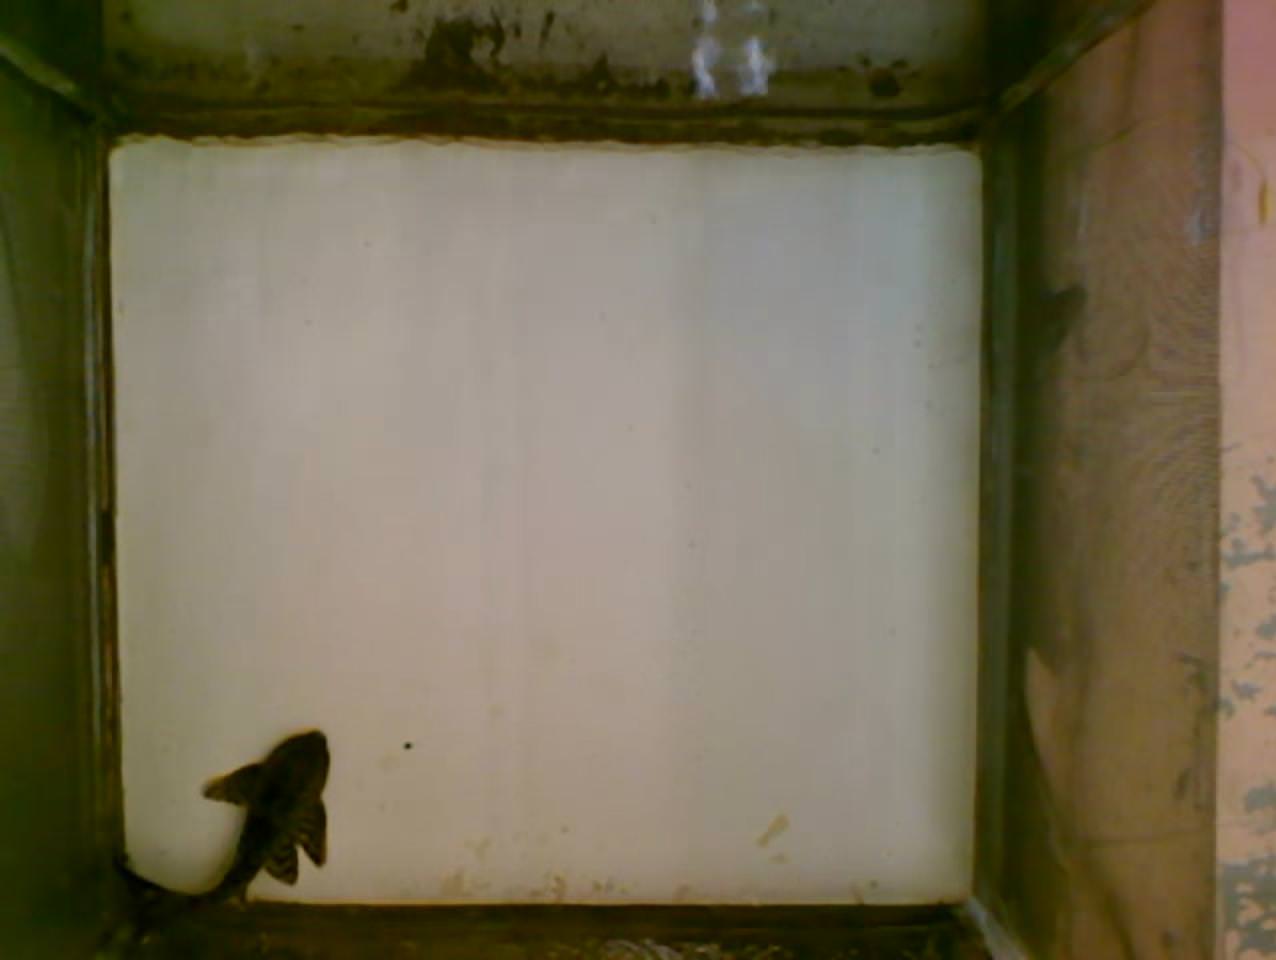
The fish sits in a square-like container in the middle of a long tube. The video camera is positioned from above, looking down, and it includes some of the container. Thus, to ensure that my image processing was as effective as possible, I wanted to eliminate the boundaries from the video.
The script would use ffmpeg to take a quick snapshot and let the user, via X11, mark with their mouse the bounds of the white background. The bounds were noted in a text file and given to ffmpeg as it begins its video collection, producing images that have the background cropped out.
Taking videos and chopping them into images
This one is simple. Use ffmpeg to record videos. There is a larger script which will read the regiment, set the motor voltage, and create videos whose title corresponds to each voltage. Once the video is done, ffmpeg will chop them into 1 frame per second.
Convert images into fish-only images
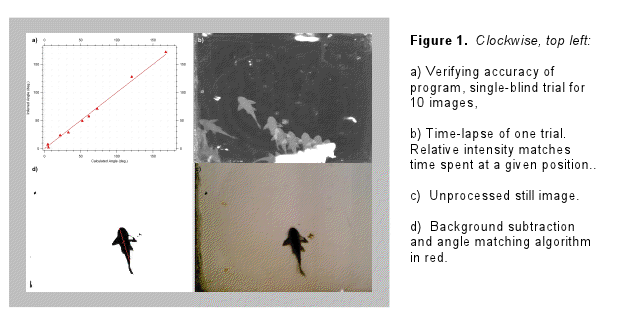
As the control script goes through the different regiments, it will pass off the previous one’s images to a binary called imager. This file will read all images into memory and create an array of values for each pixel. Because the camera does not move, each pixel then has a history where each value represents 1 second of time.
It will calculate the average value for the pixel and the standard deviation. When a particular frame experiences a large shift, it is assumed that the fish either moved into or out of that pixel. Using this data, we can get a sense of the RGB for the fish compared to the background.
We throw out all images where there was no change. For the remaining images, we apply the “background RGB” and “fish RGB” to eliminate all pixels that are not “fish-y”. We also do a sampling of the area around each “fish-y” pixel to make sure we actually have a fish, and not a speck of dust on the white-ish background.
These images are all saved, along with their timestamp. The result is a series of black-and-white images where the fish is in a new position in each one.
Determine the position of the fish
Fishes are longer than they are wide. In order to determine the orientation of the fish, we looked for the longest consecutive line you could draw through the fish. From its center, we’d take the average length of all angles from 0-360. If most of the longest ones pointed in the same direction as the long axis, the fit is said to be confident. Frames where orientation could not be confidently gauged were dropped.
The histogram became a collection of long angles (orientation) and how much time until they were in a new orientation. Surprisingly, we were getting consistent findings: high speed resulted in fish spending more time oriented into the flow of the water.

Final result, in GIF form.
Data and methodology were presented at a conference at Portland State.

Bonus silly fish GIF.